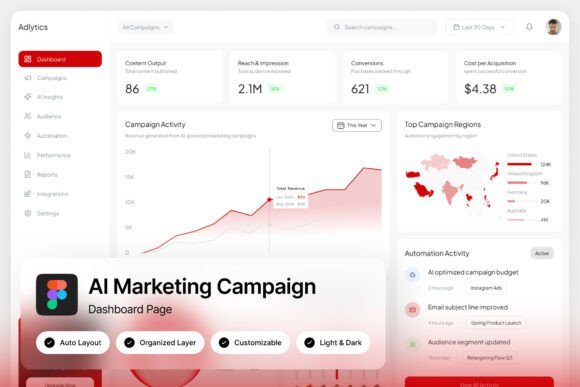
Adlytics AI Marketing Campaign Dashboard
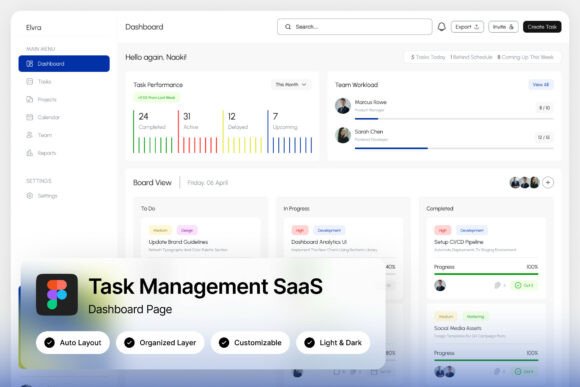
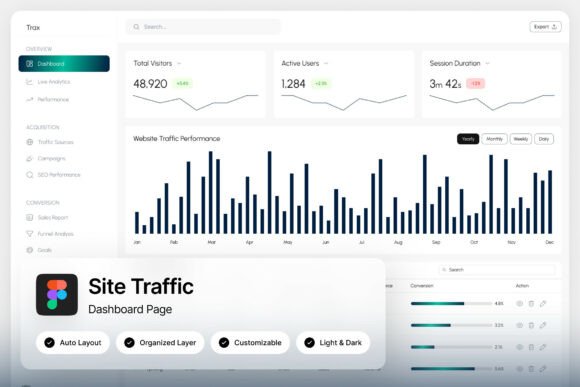
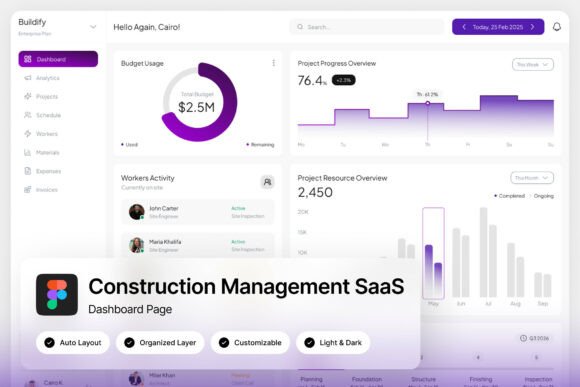
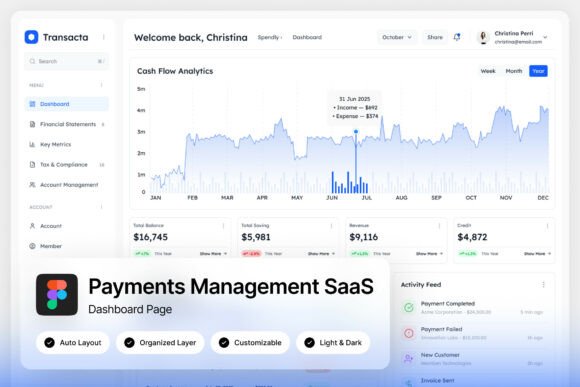
Imagine having a single, powerful command center for all your marketing data, where insights are not buried in spreadsheets but displayed with striking clarity. The Adlytics AI Marketing Campaign Dashboard is precisely that—a vibrant, data-rich UI designed to transform how performance marketers and growth teams visualize and act on their campaign metrics.
This isn't just another set of charts. Adlytics is a thoughtfully crafted interface featuring detailed ad performance metrics, intuitive audience segmentation panels, clear ROAS (Return on Ad Spend) charts, and conversion funnels. Presented in a modern green-and-dark theme, it balances professional depth with visual appeal, making complex data feel accessible and even engaging to explore.
Who Is This Dashboard For?
Adlytics is built for the fast-paced world of digital performance. It's an ideal design asset for:
- Performance Marketers & Growth Teams: Who need to monitor campaigns, allocate budgets, and prove ROI with real-time visual data.
- Ad Tech Startups & SaaS Designers: Who are building their own campaign tracking or media buying platforms and need a polished, professional UI foundation.
- Digital Marketing Agencies: Who manage multiple client accounts and require a scalable, customizable dashboard to present results clearly.
The design focuses on usability without sacrificing style. Every element, from the pixel-perfect layout to the well-organized layers, is structured for easy customization. This means you can adapt the color scheme, rearrange panels, and integrate your own branding to create a dashboard that feels uniquely yours.
Practical Design Flexibility
One of the standout features is its dual-mode interface, offering both light and dark versions. This flexibility allows you to match the dashboard to your team's working environment or your client's brand guidelines. The inclusion of free Google Fonts ensures typography remains crisp and consistent across all screens.
When working with a UI kit like this, consider these practical tips:
- Check Readability: Ensure all data labels, numbers, and tooltips remain legible at the intended resolution (1440×1024 px).
- Match the Mood: The modern green-and-dark palette conveys trust, growth, and sophistication—perfect for finance, tech, or eco-conscious brands.
- Test Integrations: Think about how this dashboard will live alongside other design assets in your project, maintaining visual consistency.
Beyond the Dashboard: Creative Applications
While designed for analytics, the visual language of Adlytics—its clean typography, structured panels, and data visualization style—can inspire other creative projects. The same principles of clarity and modern appeal apply to:
- Brand Identity Systems: Using its color palette and typographic hierarchy to develop cohesive brand guidelines.
- Editorial & Web Design: Adapting its layout logic for data-driven articles, annual reports, or SaaS website sections.
- Social Media & Presentation Graphics: Creating infographics, slide decks, or social media visuals that communicate complex information simply.
Choosing the right design assets is about finding tools that elevate your work's professionalism and efficiency. A well-constructed dashboard template like Adlytics doesn't just save time; it enhances how you communicate success, uncover opportunities, and make strategic decisions. It represents a commitment to both form and function, ensuring your marketing analytics are as compelling to view as they are crucial to understand.